Thousands of tracks. One operational picture.
Operators who watch aircraft and vessels on long shifts have to read a dense, changing situation and catch what matters in it: which signals have gone quiet, which behaviour is abnormal, and what happened before. Vigilia is a console designed for them, for sites whose networks are isolated and whose hardware is what it is.
- DESIGNED FOR
- Operators on multi-hour shifts
- RUNS ON
- One host, on the site's own network
- DATA
- Synthetic scenarios · 5,000 tracks
- STATUS
- Picture, filters and alerts built · replay next
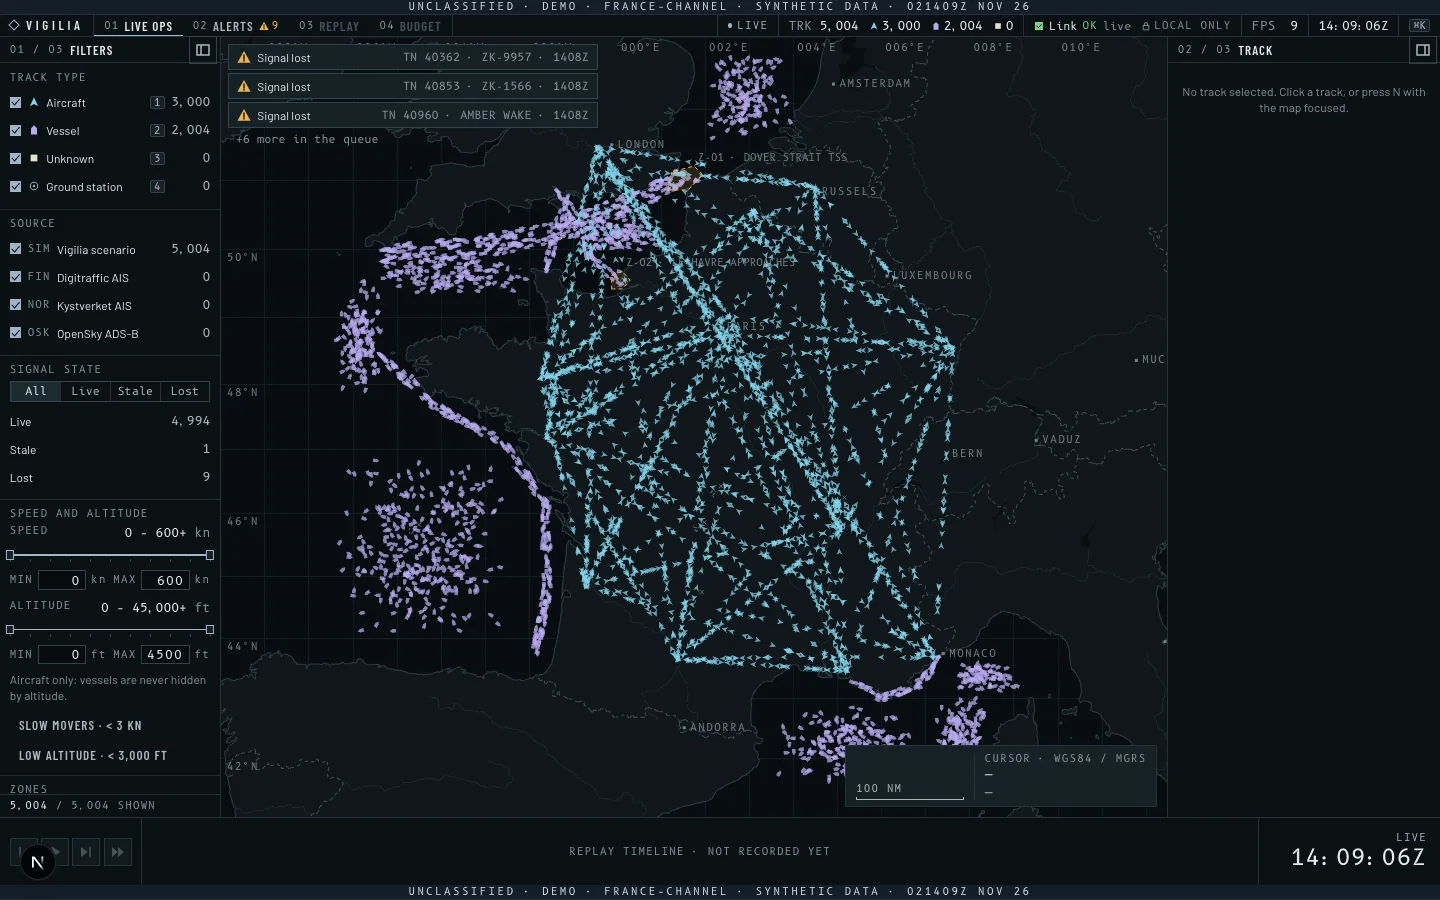
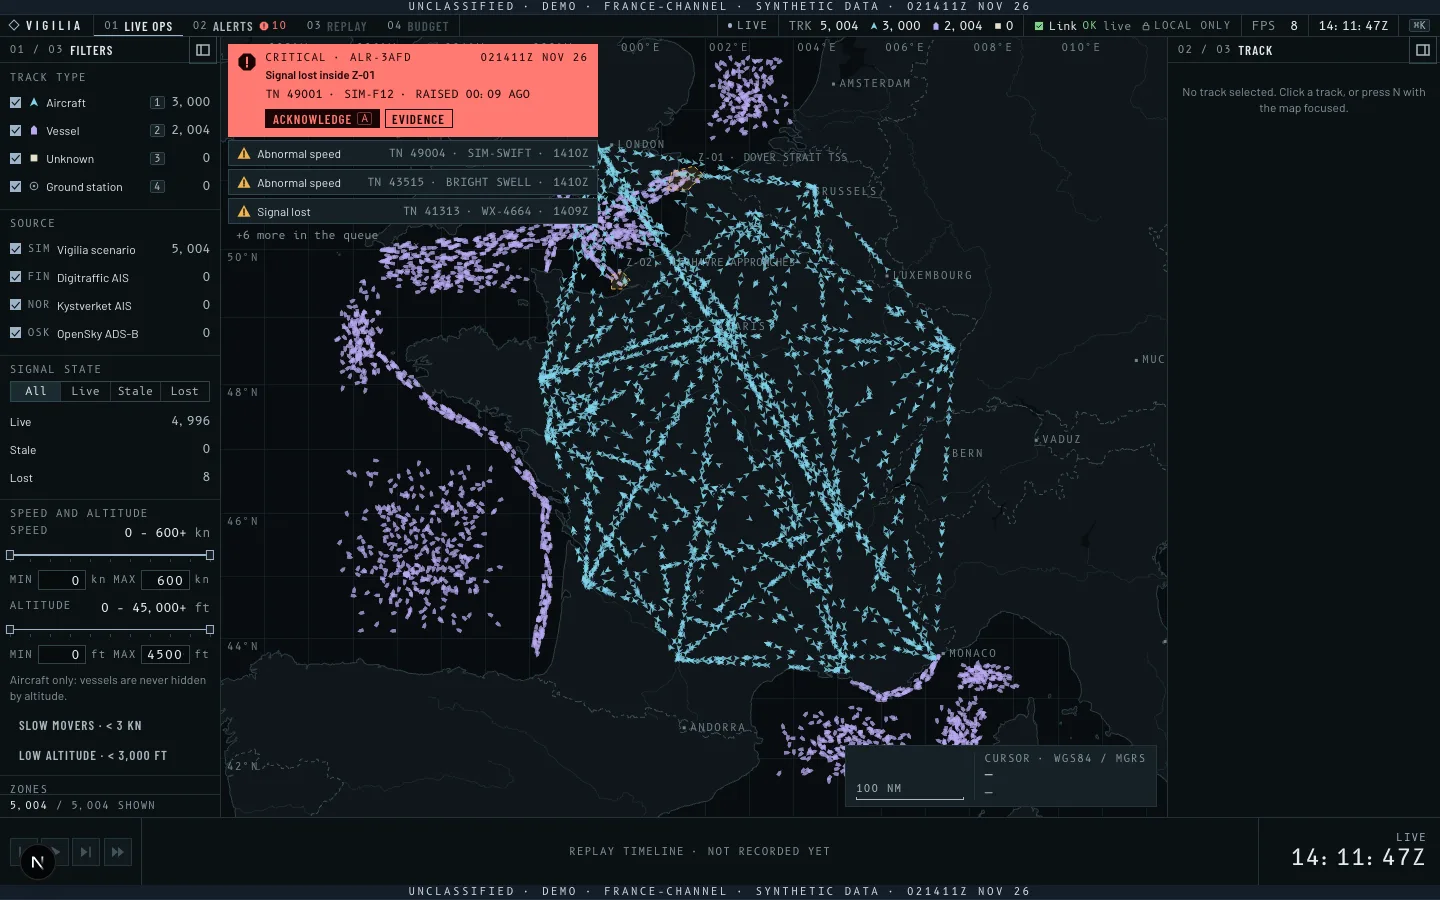
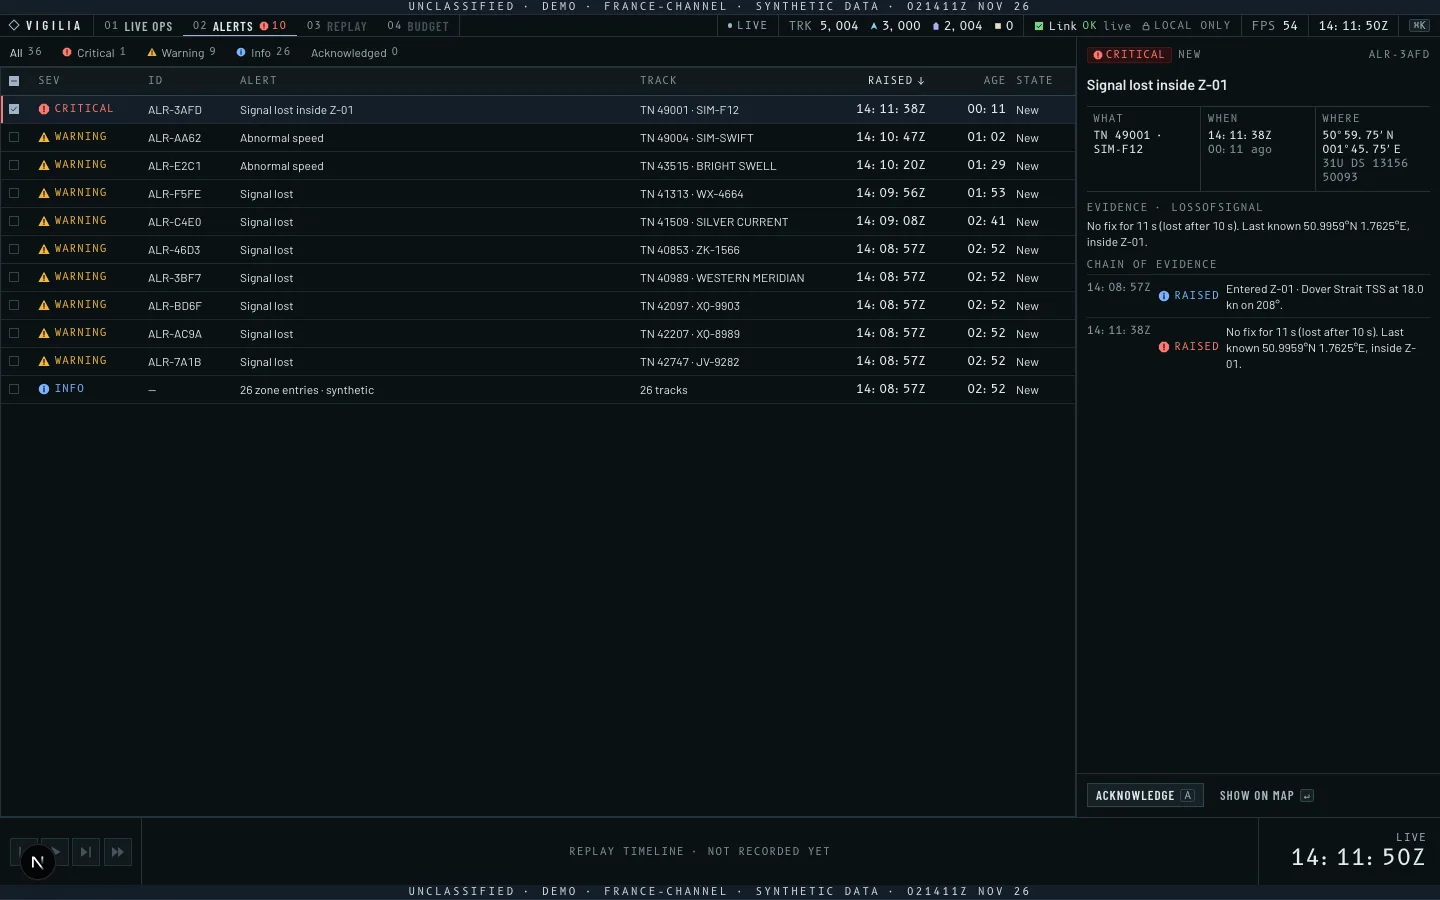
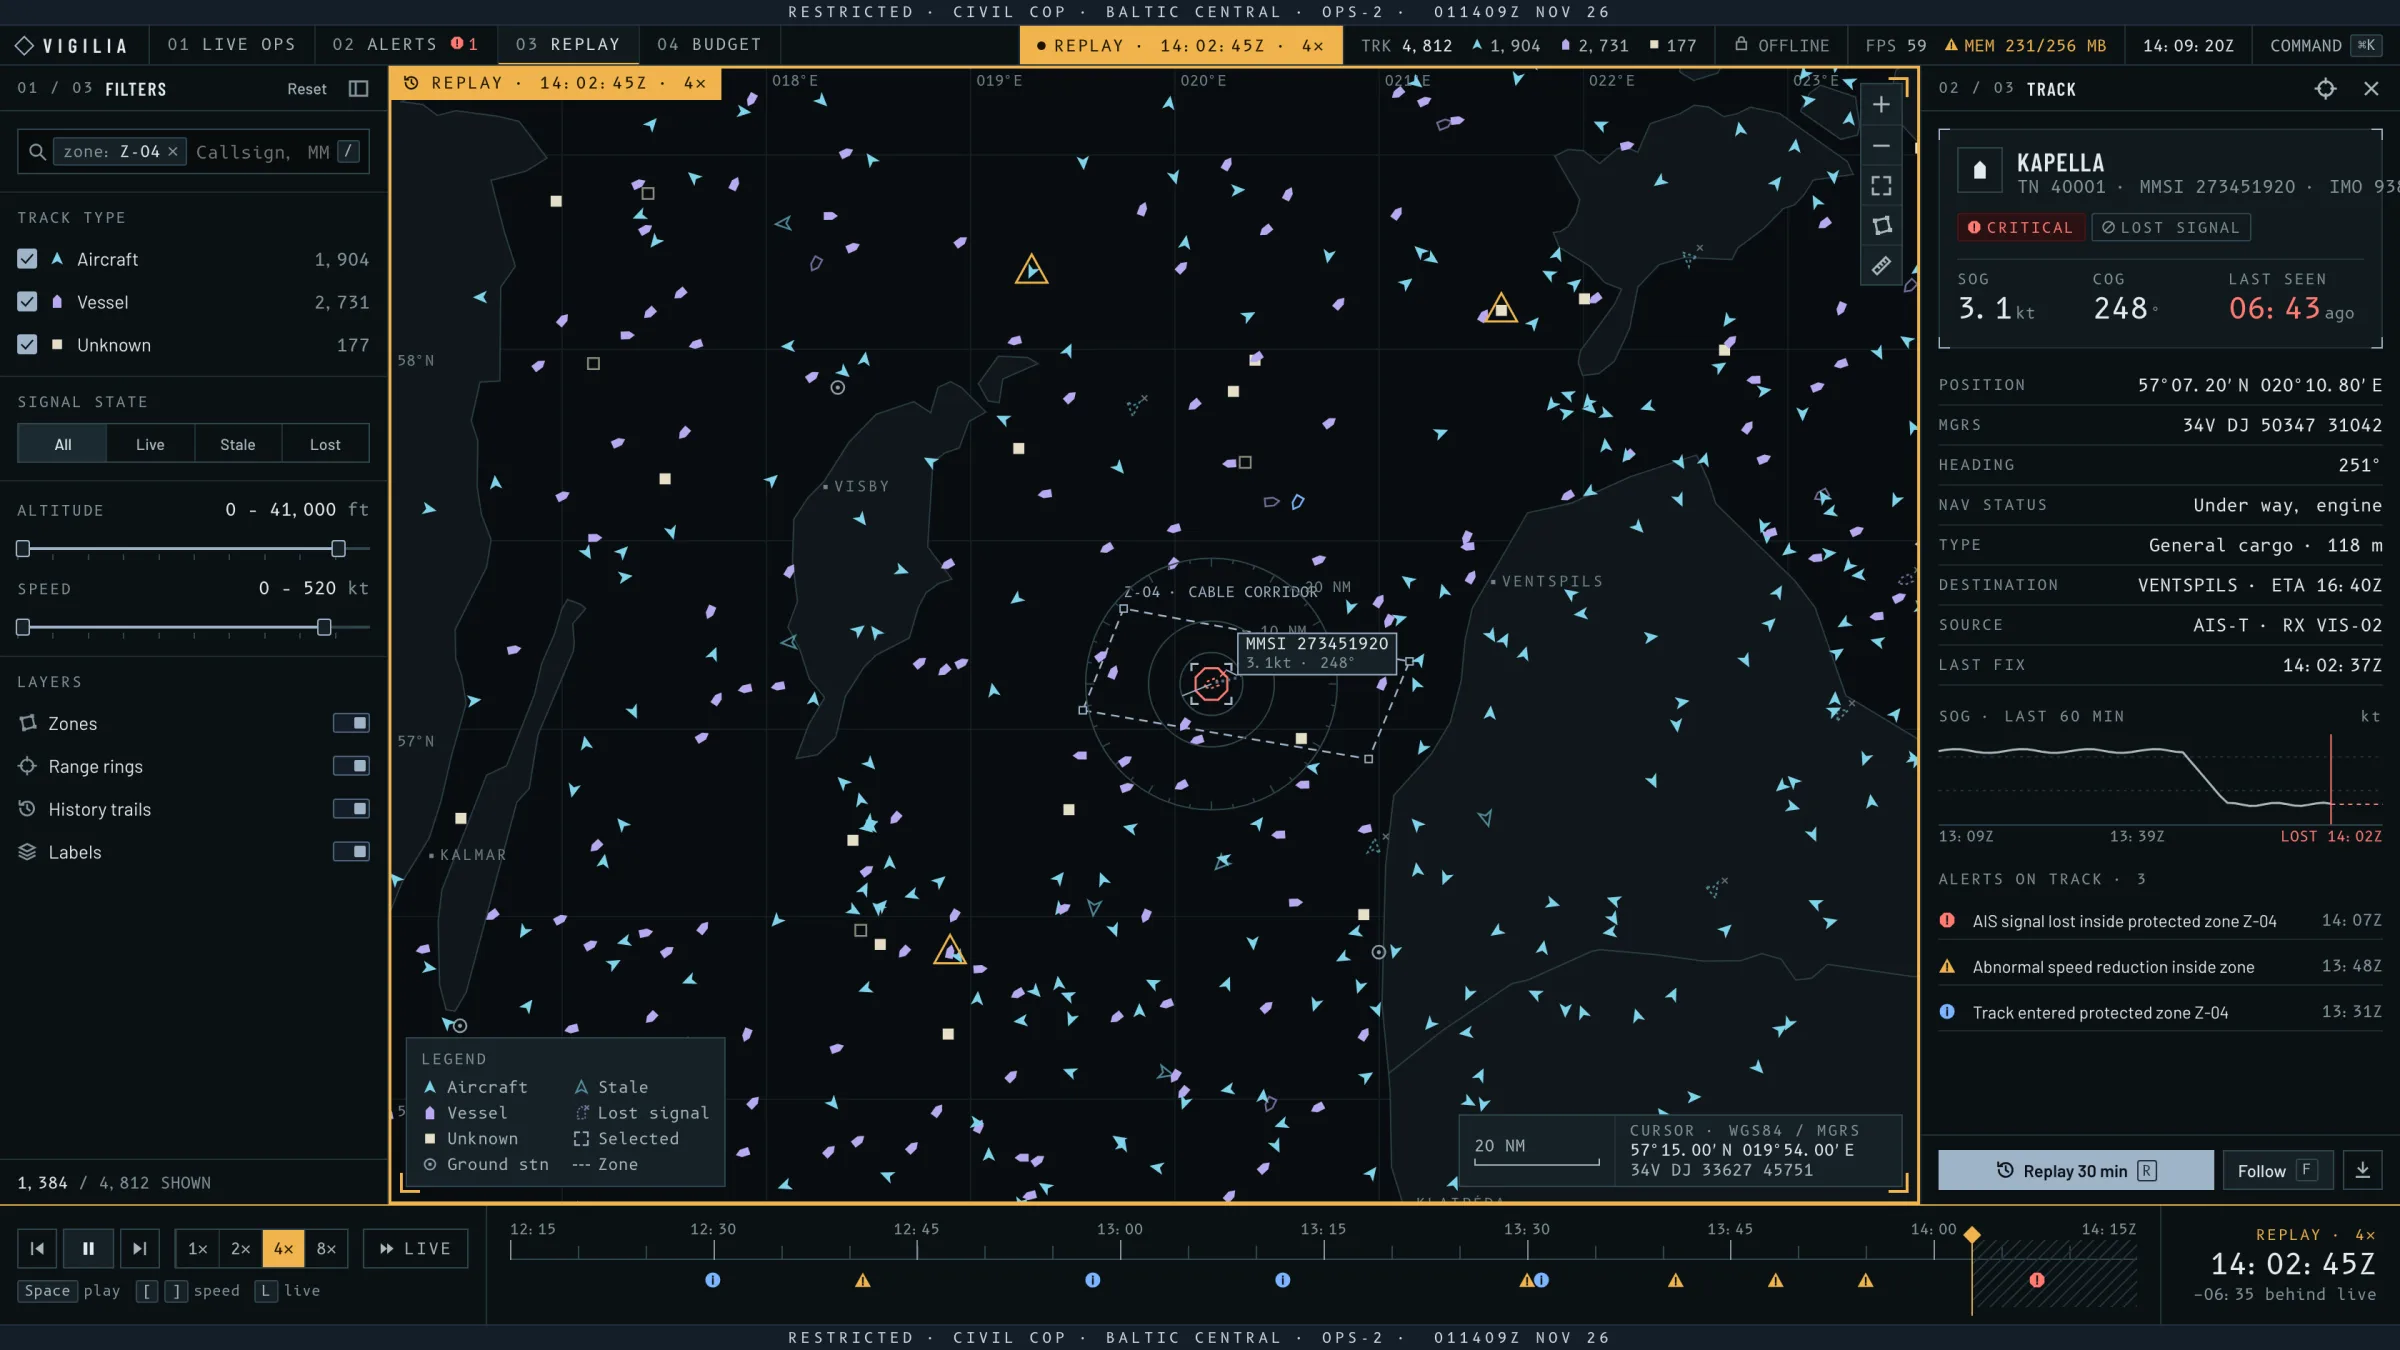
Dense, moving, partly reliable.
Three needs shaped the console. Each is a way an operator can miss what matters: an old position read as current, a real alert lost among false ones, an event nobody can reconstruct.
Signal quality, at a glance
A position from four minutes ago must never pass for a current one. Every track shows whether its signal is live, stale or lost, in its shape as well as its colour.
Alerts that earn attention
Each alert says why it fired, with its evidence. A condition must hold before it raises, so it does not flap, and a burst of similar alerts arrives as one line.
- Planned
Review after the fact
When something happened, the team replays it: what was on screen, when, and what the console said about it.
Where it has to run.
The sites this is designed for set four constraints. Every trade-off below names the one it answers.
Isolated networks
Sites run on networks with no route to the internet. Map, fonts, icons and data install with the console, which talks to its own server only.
Sovereignty and security
Data stays on the site's machines. Every third-party package is a recorded decision, with its licence and size, so the code to audit stays small and known.
Limited hardware
Consoles run on the machines a site already has. The picture stays fluid with thousands of tracks on an integrated laptop GPU, measured against a budget.
Interoperability
The console sits among existing tools. It uses the formats the field knows: PMTiles for the basemap, GeoJSON for zones and exports, AIS and ADS-B as sources.
Weighed, chosen, and why.
Each decision has a written record in the repository, with the alternatives and the measurements behind it.
- 01
Drawing the map and the tracks
Decision record 0002 · 0005- Weighed
- MapLibre GL · OpenLayers · a dedicated WebGL2 renderer
- Chosen
- A dedicated WebGL2 renderer over a standard PMTiles basemap, kept after measuring both libraries against it.
- Because
- Limited hardware: it holds 20,000 moving tracks within one 60 Hz frame and adds a few kilobytes to the console, where the libraries add 186 to 290 KB.
- How
- Measured with one harness on the same archive: at 20,000 tracks the dedicated renderer keeps a 16.7 ms p95 frame, MapLibre GL's documented path 33.4 ms, OpenLayers' 700 ms. MapLibre GL leads on label placement and a shared style specification, OpenLayers on drawing tools and projections. The record names when to switch: shared styles, 3D or a larger budget for MapLibre GL; other projections for OpenLayers.
- 02
Basemap and data formats
- Weighed
- A tile server · raster tiles · project-specific files
- Chosen
- One PMTiles archive of vector tiles for the basemap; GeoJSON for zones, scenarios and exports.
- Because
- One file to install on an isolated site, and formats that GDAL, QGIS and the site's own tools already read.
- How
- The archive is served by byte range from the console's own server, which is all PMTiles needs. Zones import and export as GeoJSON FeatureCollections (RFC 7946); scenario files describe their zones and routes as GeoJSON features.
- 03
Getting tracks to the screen
Decision record 0003- Weighed
- REST polling · Server-Sent Events · WebSocket with JSON
- Chosen
- One WebSocket carrying compact binary records, decoded in a background worker.
- Because
- Limited hardware: a 5,000-track update is about a tenth of its JSON size, and decoding stays off the interface's thread.
- How
- Each track is a fixed 32-byte record in a versioned frame; commands travel as small JSON messages on the same socket. A slow client gets its pending updates folded into one, so the server's memory stays bounded.
- 04
Raising alerts
- Weighed
- Learned anomaly scores · explicit rules
- Chosen
- Deterministic rules, each alert carrying its evidence, scored against the scenario's ground truth.
- Because
- An operator must understand and trust why an alert fired, and an after-action review must get the same alerts from the same data.
- How
- Rules run in the browser's worker on every update, on the stream's own clock: loss of signal on each source's timeouts, abnormal speed, abrupt course change, loitering, zone entry. Each waits for its condition to hold and to clear, so alerts do not flap.
- 05
Third-party code
- Weighed
- The usual package graph · a reviewed, recorded set
- Chosen
- Each package is a recorded decision, with its licence, size and reason, checked before every deploy.
- Because
- Sovereignty and security: a short, known list is what a site's security team can review.
- How
- A ledger lists every direct dependency of the four projects; the deploy's quality gate fails when a package is missing from it or a row names one no longer used.
- 06
Running on an isolated site
- Weighed
- A hosted service · containers pulled at install · one self-contained bundle
- Chosen
- Everything ships with the console and stays on its own origin; a single installable image is next.
- Because
- Isolated networks: the site installs one artefact and the console works the moment it starts.
- How
- A content-security policy holds the browser to the console's own origin. Next: one image that starts with networking switched off, verified by running the browser tests against it in that state.
- 07
Server runtime
Decision record 0004- Weighed
- Rust · Go · Node with TypeScript
- Chosen
- Node with TypeScript, sharing one track model with the front.
- Because
- One language and one data model for a small team; the server's load is input and output, where Node is at its best.
- How
- The conditions under which this would be revisited are written in the decision record.
Numbers from the build.
Each figure comes from the production build and is held by a test, so it cannot drift unnoticed.
- Frame time
- 16.8 ms p955,000 moving tracks while panning and zooming: one 60 Hz frame. Budget 18 ms. (@perf suite)
- Main thread
- < 50 ms per task20,000 tracks updated every second for 10 s: decoding stays in a worker, the interface stays responsive. (@perf suite)
- Update size
- 160 KBA 5,000-track update in binary records, against 1.9 MB as JSON: a tenth of the bandwidth on a site link.
- Alert rules
- 3.8 msAll five rules evaluated on 20,000 tracks, per update. Budget 4 ms. (unit test)
- Alert quality
- ≥ 0.95 precision · recallAgainst the ground truth the scenario generator logs, on both scripted scenarios. (unit test)
- Filters
- 0.5 msKind, source, signal, speed and altitude applied to 20,000 tracks, per frame.
Apple M1 · production build · Chromium · measured 2026-11-02
One host, end to end.
- SOURCE
Scenario
- seeded and repeatable
- scripted events
- ground truth logged
- API
NestJS
- /api/stream · WebSocket
- binary frames
- /tiles · byte range
- WORKER
Decode and evaluate
- Web Worker
- typed arrays
- alert rules
- RENDER
WebGL2
- PMTiles basemap
- instanced track glyphs
- 60 fps
- OPERATOR
Console
- Next.js 16 · React 19
- keyboard-first
- three themes
Held to its own origin. Fonts, icons and the basemap are installed with the console, and a content-security policy limits the browser to the console's own server.
One model, end to end. A plain-TypeScript track model, shared by the server, the worker and the alert engine.
Decisions written down. Graphics API, map rendering, transport and server runtime each have a decision record with the measurements behind it.
A work in progress.
Built in the open, ticket by ticket. What is built runs at the address above; what is next is planned with its acceptance criteria.
Built
- Live picture5,000 synthetic aircraft and vessels with live, stale and lost signals, on an offline basemap.
- Track detail and filtersEvery field of a track, filters by kind, source, signal, speed and altitude.
- AlertsFive rules with their evidence, a queue grouped by severity, acknowledgement, watched zones.
- Standard formatsPMTiles basemap read by the format authors' own readers; GeoJSON zones, scenarios and exports; CSV alert log.
- Design systemNight, NVG-safe and briefing themes, contrast and colour-vision tested.
In progress
- Zone drawingDraw and edit a watched zone on the map, with the mouse or the keyboard.
Next
- Real sourcesOpen AIS feeds (Finland, Norway) and ADS-B, through one adapter interface.
- ReplayRecorded sessions on the timeline, framed so they are never taken for live.
- Air-gapped bundleOne image, verified with networking switched off.
- Resource budgetFrame time, memory and bandwidth, measured and shown live.
See it run.
The console runs on synthetic data: 5,000 tracks over France and the Channel. Add ?scenario=channel-night to the address to watch a scripted evening unfold.